Exploratory data analysis
EDA allows to:
- Better understand the data
- Build an intuition about the data
- Generate hypothesizes
- Find insights
Visualizations
- Visualization -> idea: Patterns lead to questions
- Idea -> Visualization: Hypothesis testing
With EDA we can:
- Get comfortable with the data
- Find magic features
Do EDA first. Do not immediately dig into modelling.
Build Intuition about the Data
- Get domain knowledge
- It helps to deeper understand the problem
- Check if the data is intuiitive
- And agrees with domain knowledge
- Understand how the data was generated
- As it is crucial to set up a proper validation
- As it is crucial to set up a proper validation
Exploring Anonymized Data
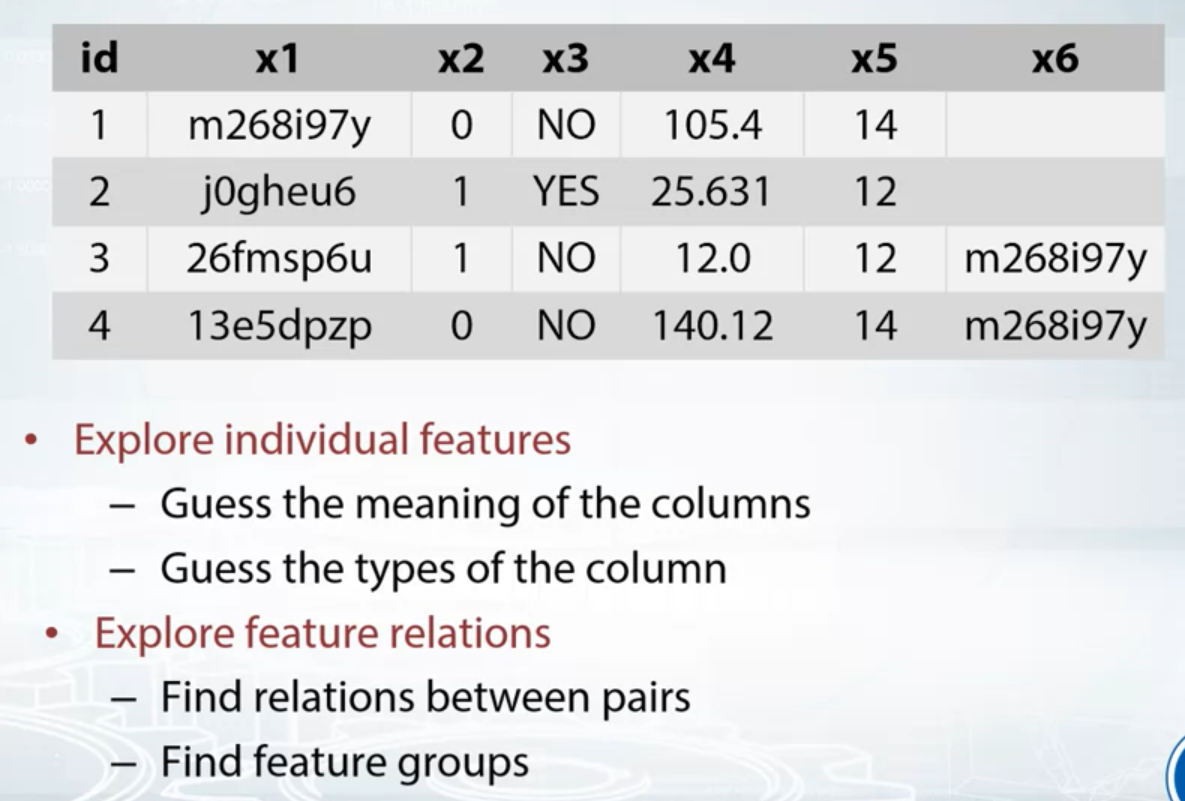
Try to Decode the Features
Guess the true meaning of the feature.
Exploring Individual Features: Guessing Types
Helpful functions:
- df.dtype
- df.info()
- x.value_counts()
- x.isnull()
Visualization Tools
EDA is an art! And visualizations are our art tools.
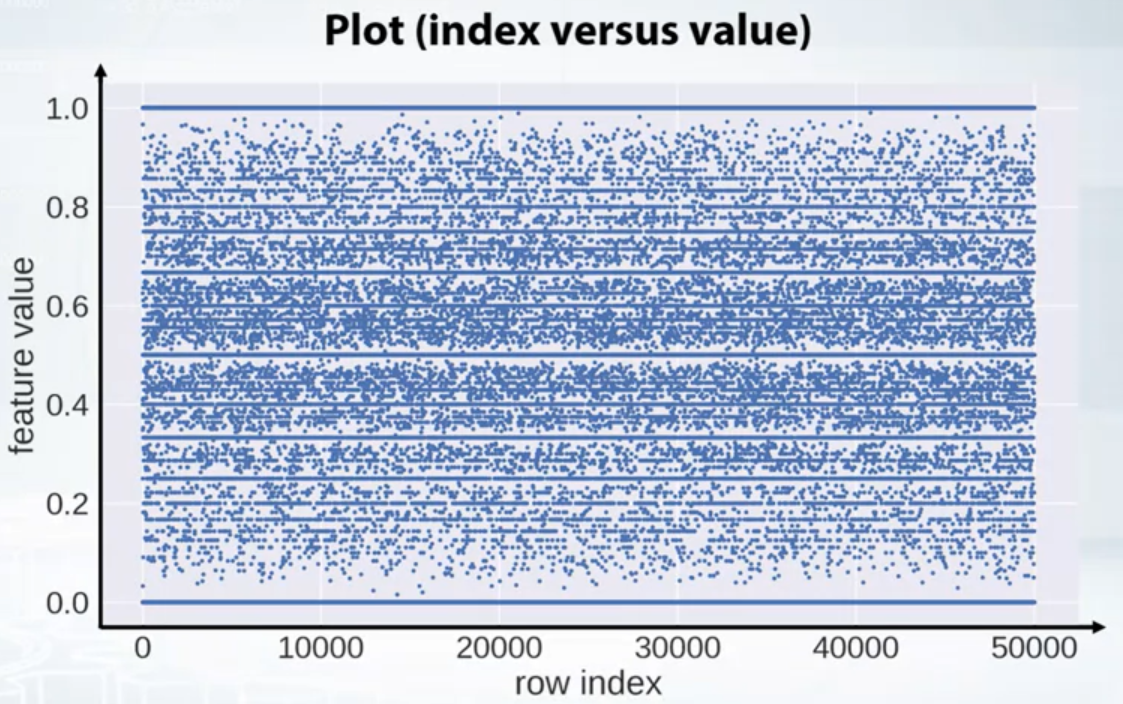
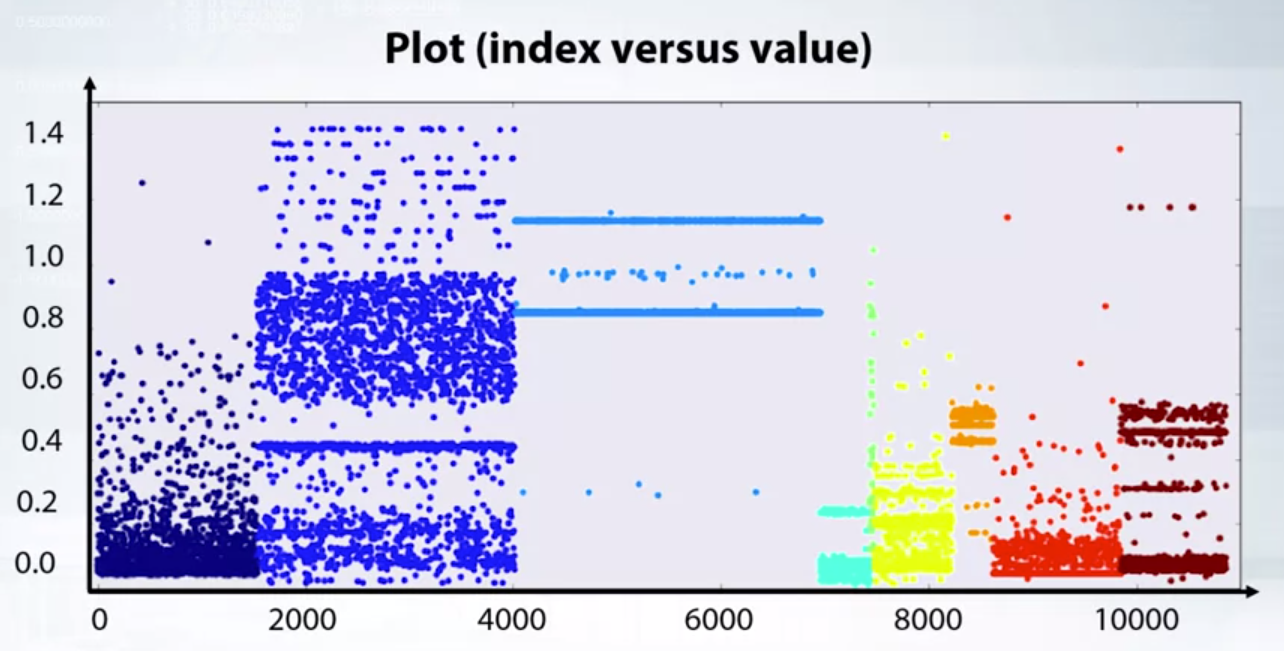
Exploring Individual Features: Plotting
- Histograms: plt.hist(x)
- Plot: plt.plot(x, ‘.’) (index vs values)
- plt.scatter(range(len(x), x, c=y))
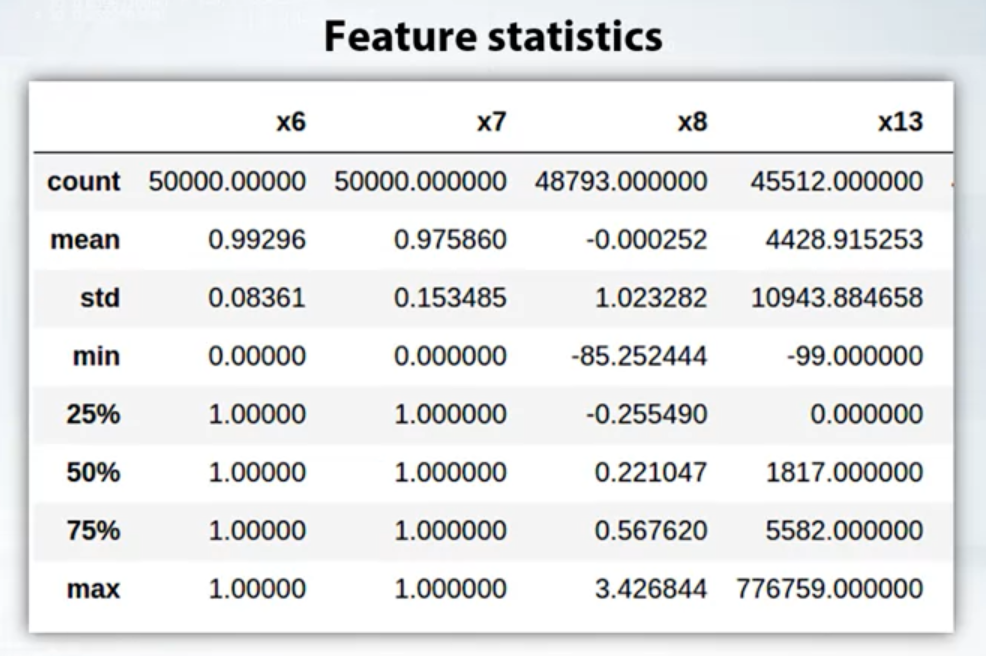
- Feature Statistics
- df.describe()
- x.mean()
- x.var()
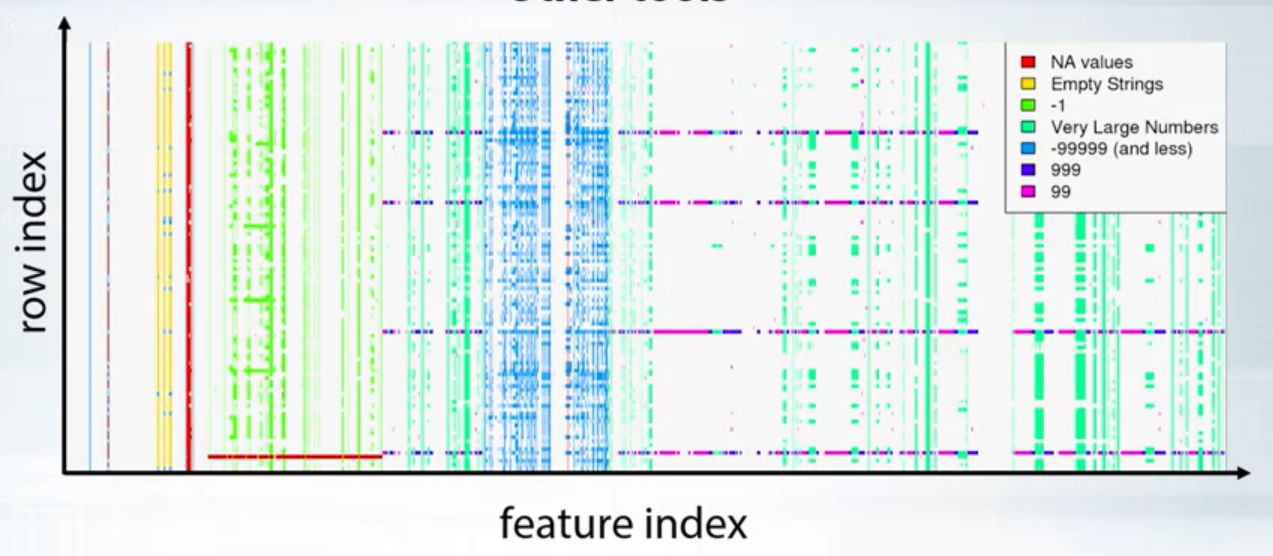
- Other Tools
- x.value_count()
- x.isnull()
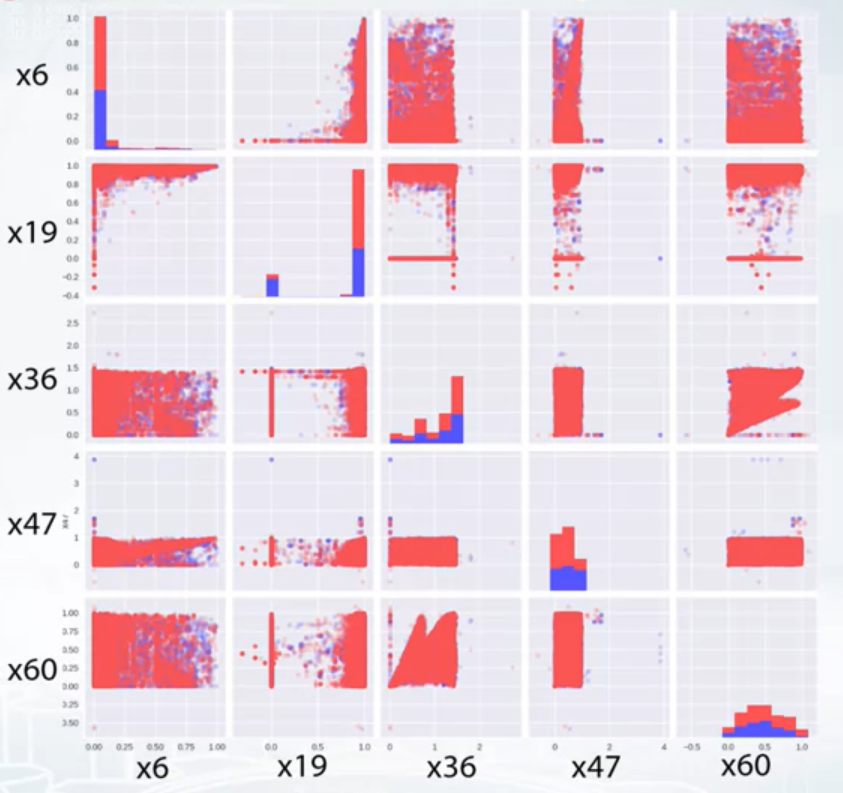
Exploring Feature Relations
- Pairs
- plt.scatter(feature_1, feature_2)
- pd.scatter_matrix(df)
- df.corr(), plt.matshow()
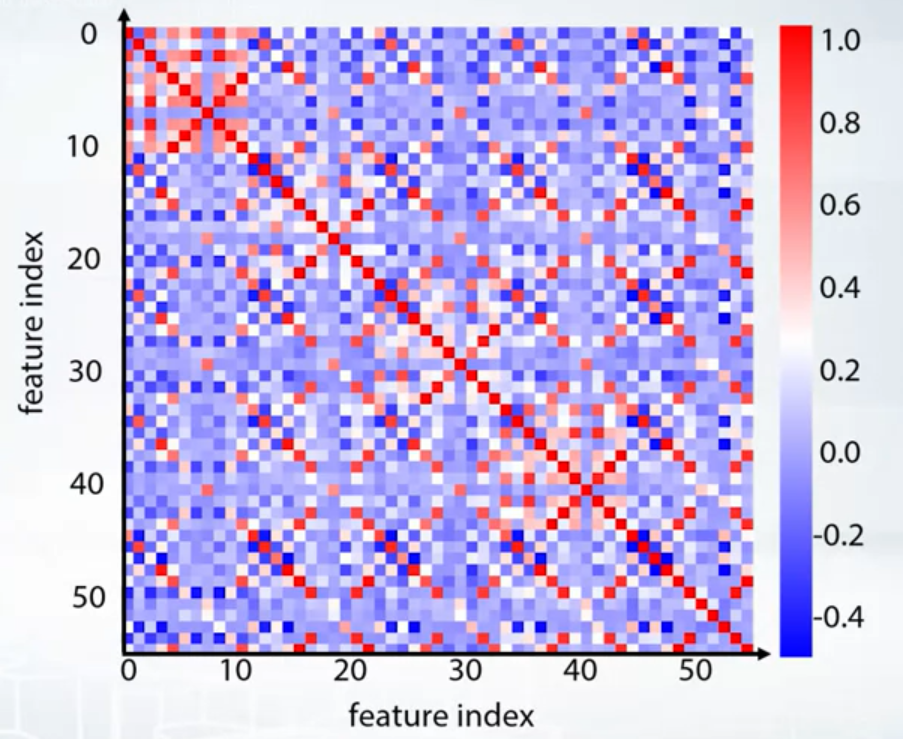
- Groups
- Corrplot + clustering
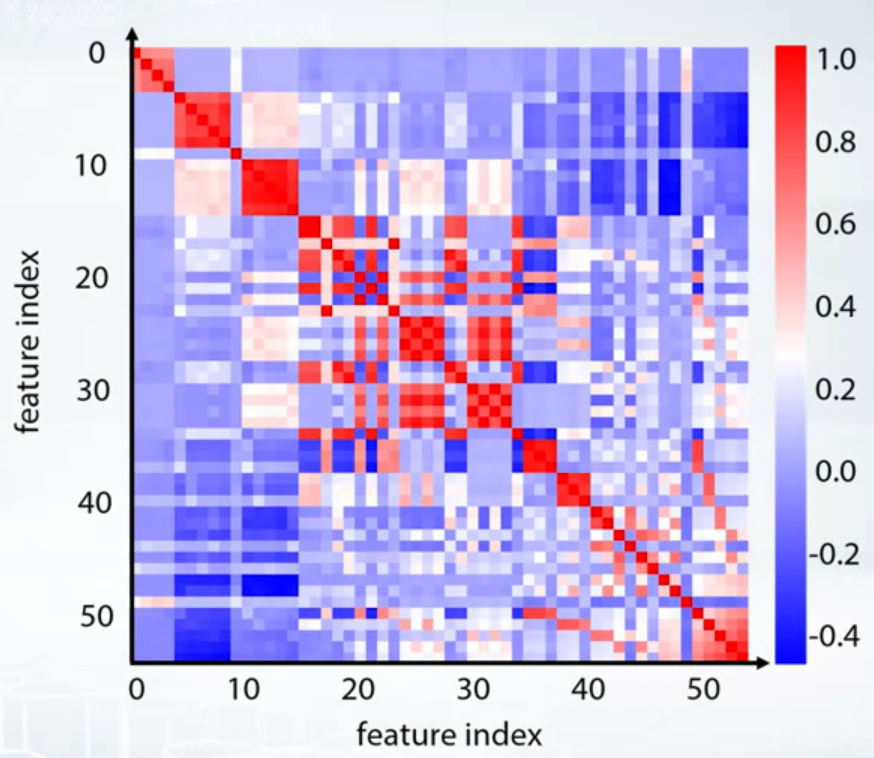
- Corrplot + clustering
- df.mean.sort_values().plot(style=‘.’)
Dataset Clean and the Other Things to Check
Dataset cleaning
- Constant Features: train_df.nunique(axis=1) == 1
- Duplicated Features: train_df.T.drop_duplicates()
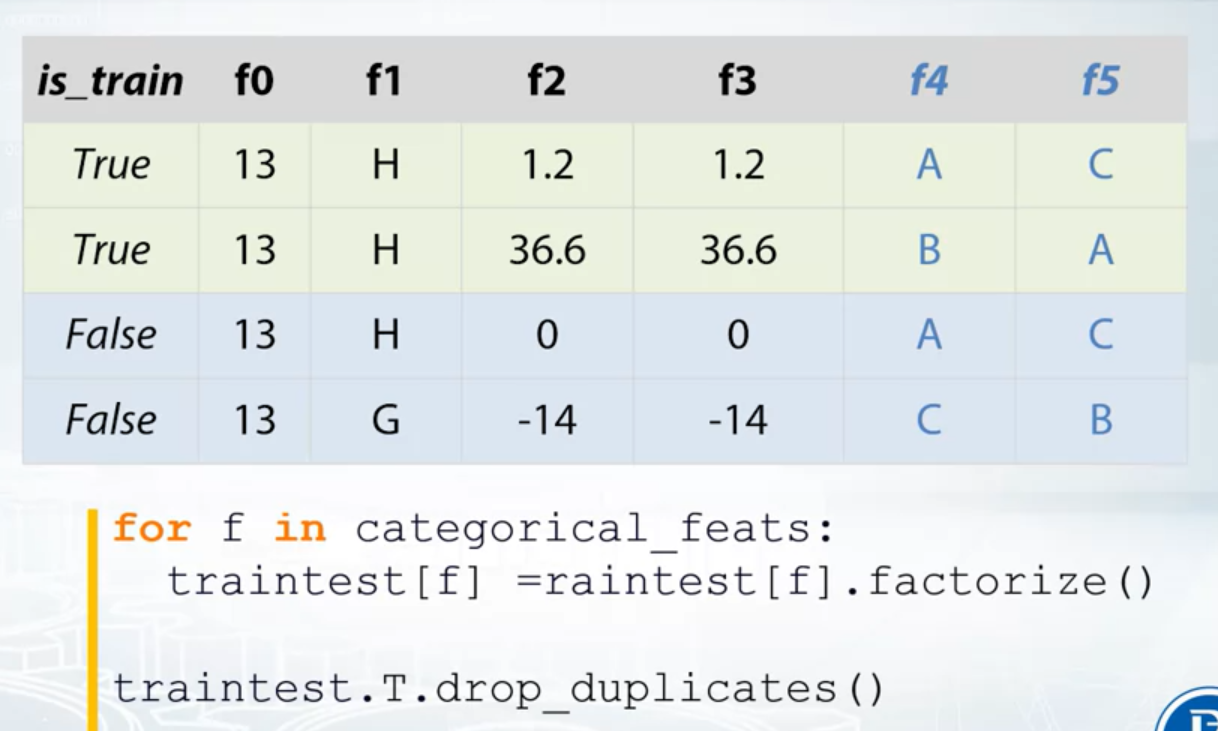
Other things to check
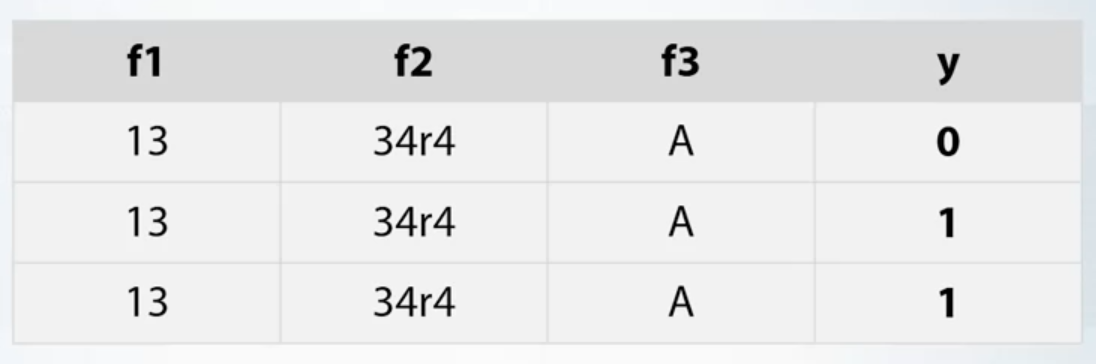
- Duplicated rows
- Check if same rows have same label
- Find duplicated rows, understand why they are duplicated
- Check if dataset is shuffled
- Duplicated rows
Validation and Overfitting
Validation
- It helps us evaluate a quality of the model
- It helps us select the model which will perform best on the unseen data
Underfitting VS Overfitting
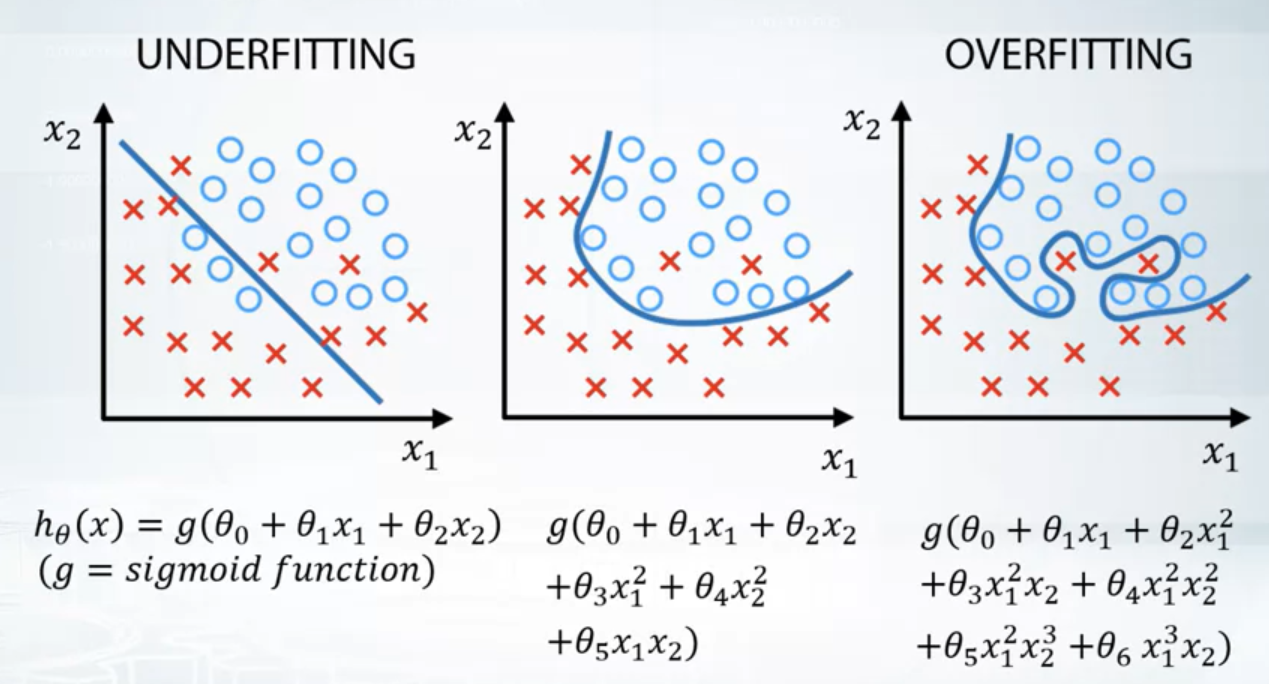
- Underfitting refers to not capturing enough patterns in the data
- Generally, overfitting refers to:
- capturing noise
- capturing patterns which do not generalize to test data
- In competition, overfitting refers to:
- low model quality on test data, which was unexpected due to validation scores
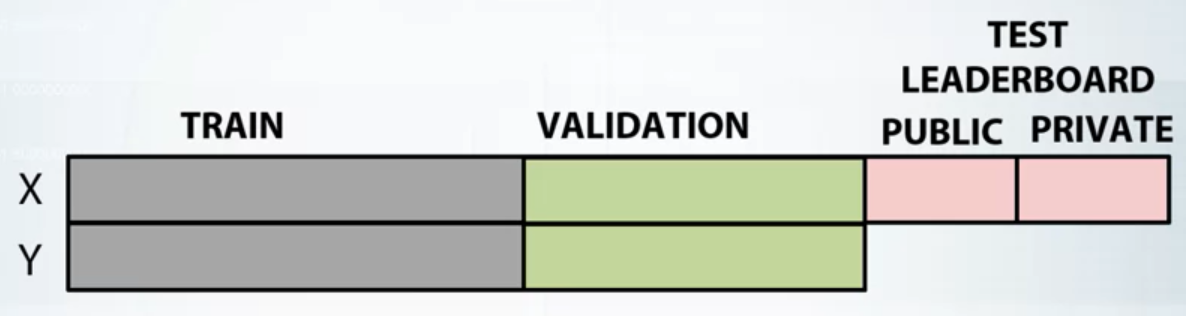
Validation Strategies
Never use data you train on to measure the quality of your model. The trick is to split all your data into training and validation parts.
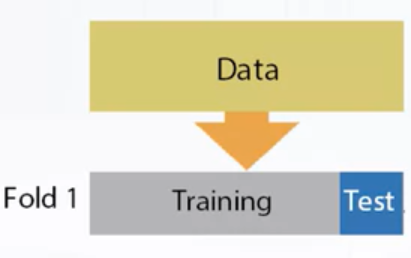
- Holdout
- ngroups=1
- sklearn.model_selection.ShuffleSplit()
- Split train data into two parts: partA and partB
- Fit the model on partA, predict for partB.
- Use predictions for partB for estimating model quality. Find such hyper-parameters, that quality on partB is maximized
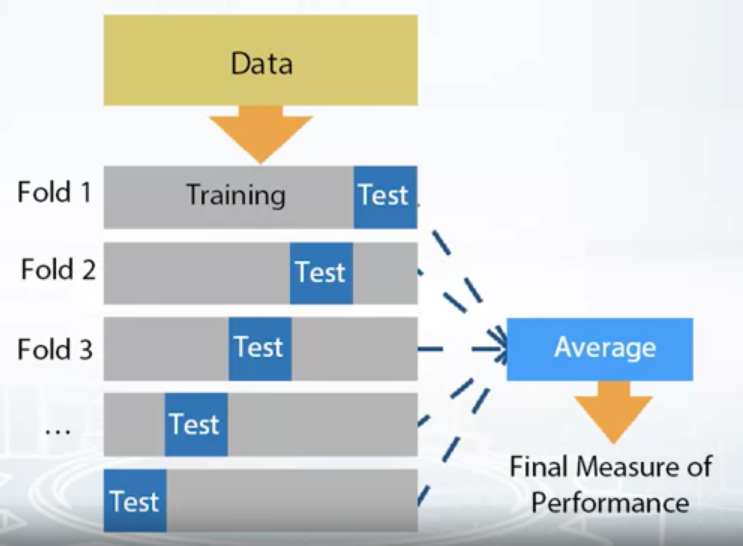
- K-fold
- ngroups=k
- sklearn.model_selection.Kfold
- KFold is similar to Holdout repeated K times
- Split train data into K folds
- Iterate though each fold: retrain the model on all folds except current fold, predict for the current fold
- Use the predictions to calculate quality on each fold. Find such hyper-parameters, that quality on each fold is maximized
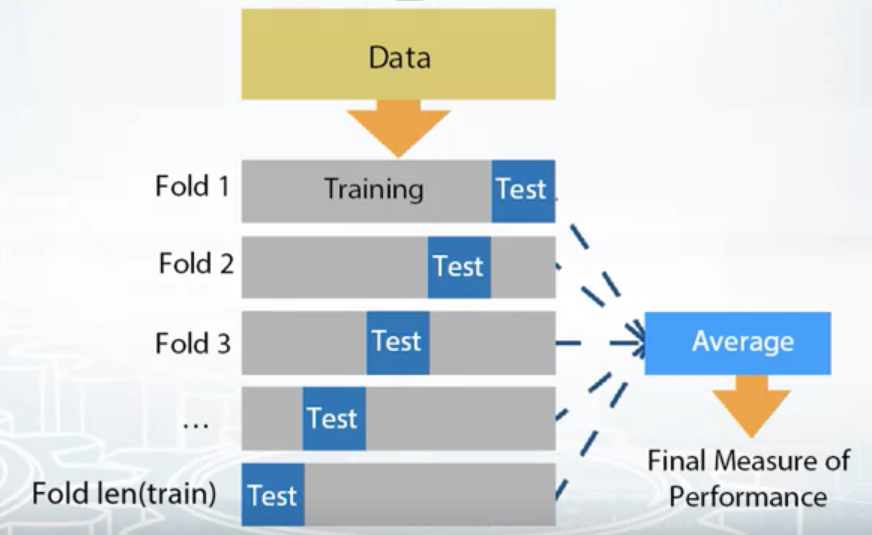
- Leave-one-out (LOO)
- ngroups=len(train)
- sklearn.model_selection.LeaveOneOut
- Iterate over samples: retrain the model on all samples except current sample, predict for the current sample. You will need to retrain the model N times (if N is the number of samples in the dataset)
- In the end you will get LOO predictions for every sample in the trainset and can calculate loss
Notice, When you found the right hyper-parameters and want to get test predictions don’t forget to retrain your model using all training data.
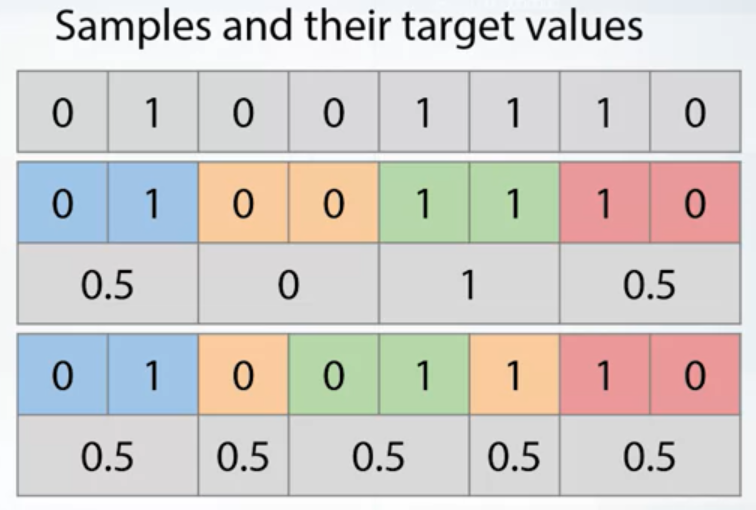
Stratification
It preserve the same target distribution over different folds. It’s useful for:
- Small datasets
- Unbalanced datasets
- Multiclass datasets
Data Splitting Strategies
The validation should always mimic train/test split made by organizers.
Logic of feature generation depends on the data spitting strategies.
Different Approaches to Validation
Different splitting strategies can differ significantly
- in generated features
- in a way the model will rely on that features
- in some kind of target leak
Common Methods
- Random, row-wise
- This usually means that the rows are independent of each other
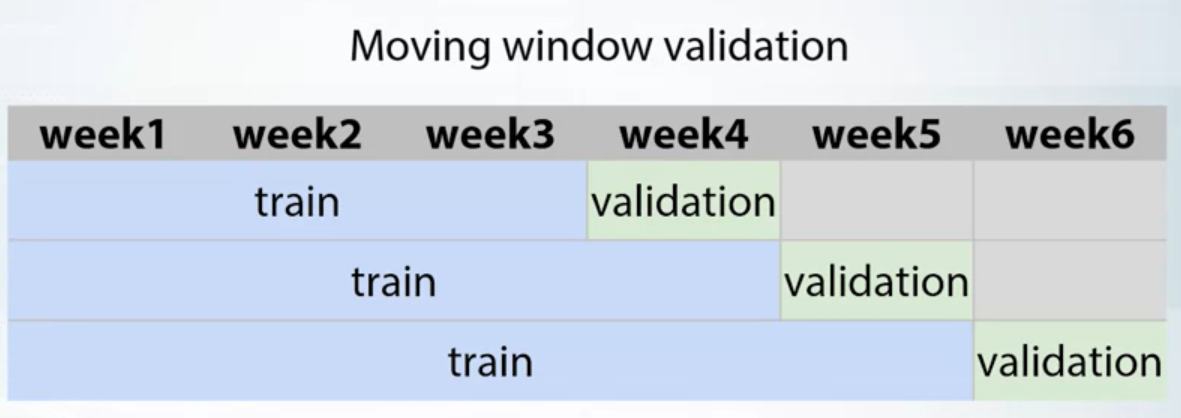
- Time-wise
- Split the data by a single date.
- By ID
- Combined
Problems Occurring during Validation
Validation Stage
Causes of different score and optimal parameters:
- Too little data
- Too diverse and inconsistent data
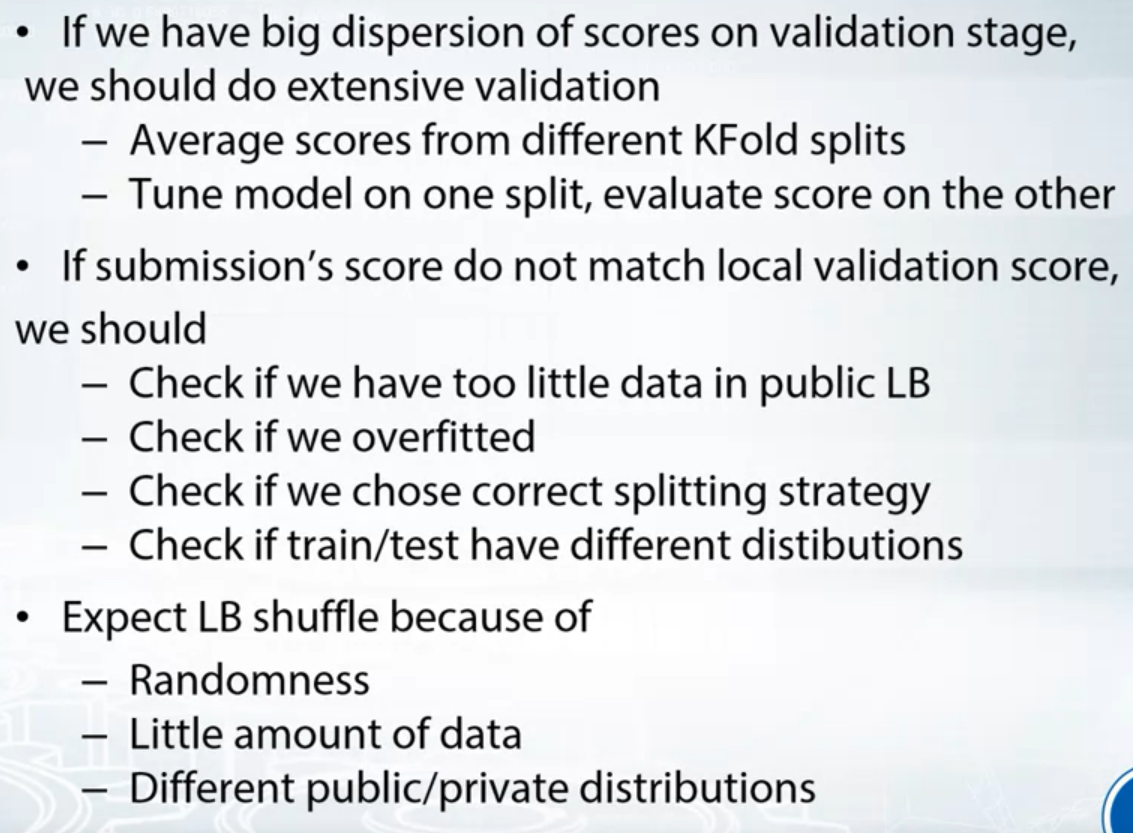
We should do extensive validation:
- Average scores from different KFold splits
- Tune model on one split, evaluate score on the other
Submission Stage
We can observe that:
- LB score is consistently higher/lower than validation score
- LB score is not correlated with validation score at all.
Possible problem:
- Incorrect train/test split
- Too little data in public LB
- train and test data are from different distributions
Conclusion
Data Leakages
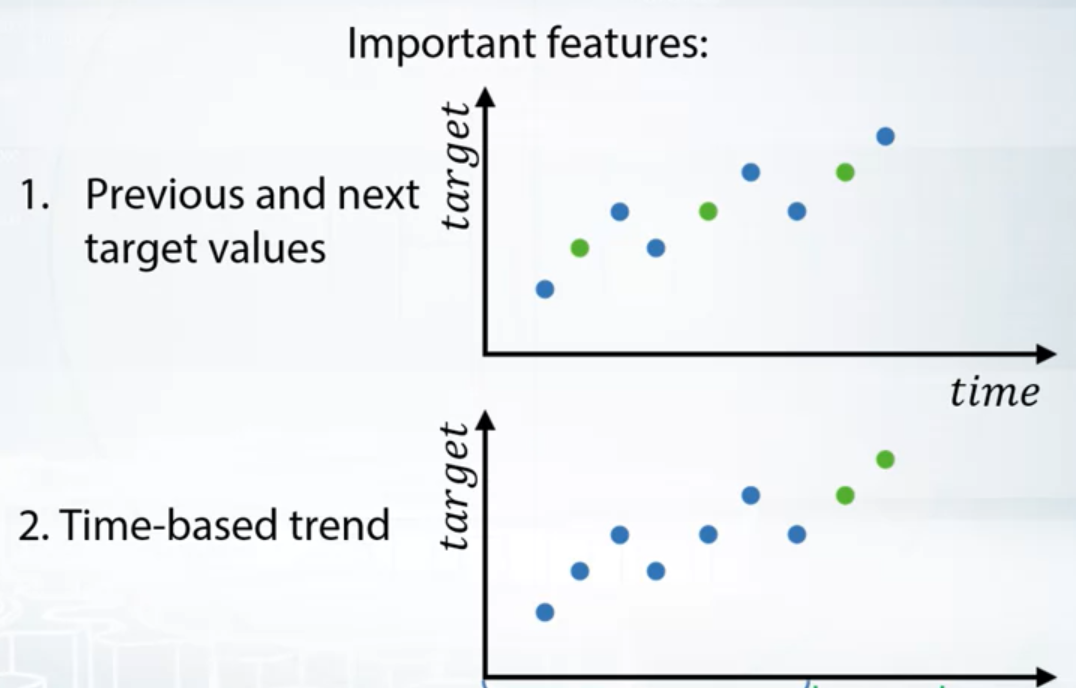
Data Leakages in Time Series
- Split should be done on time
- In real life we don’t have information from future
- In competitions first thing to look: train/public/private split, is it on time?
- Even when split by time, features may contain information about future:
- User history in CTR tasks
- Weather
Unexpected Information
- Meta data
- Information in IDs
- Row order
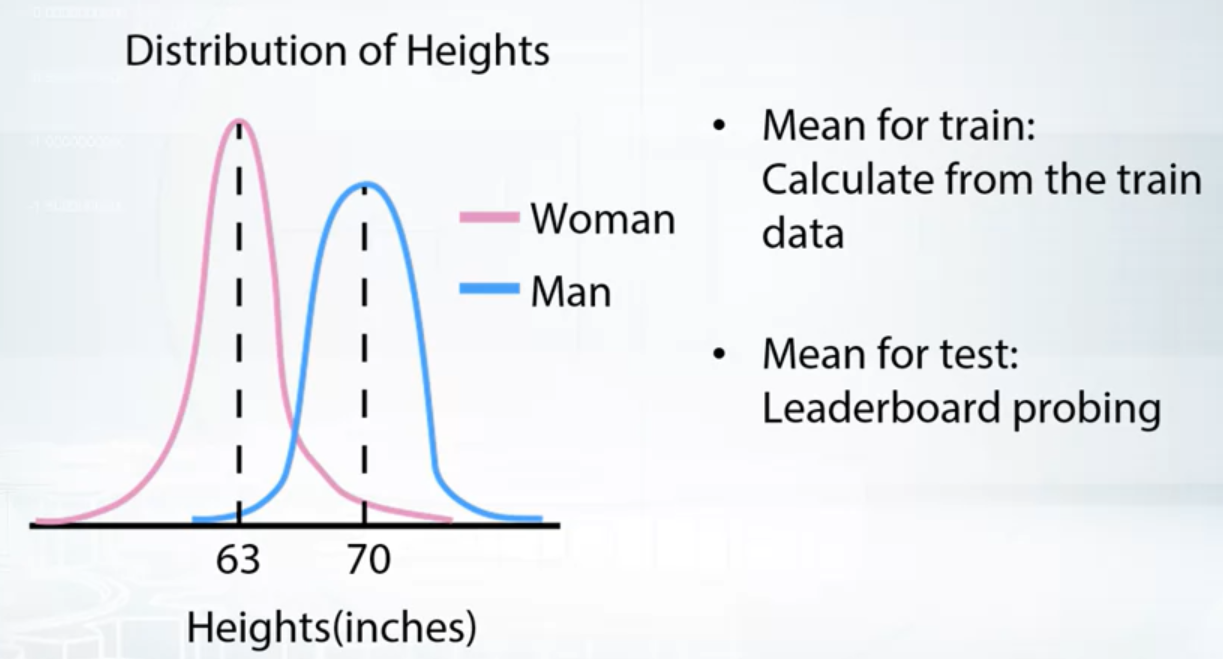
Leaderboard Probing
- Types of LB probing
- Categories tightly connected with “id” are vulnerable to LB probing
Metrics Optimization
If you model is scored with some metric, you get best result by optimizing exactly that metric.
Different metrics for different problems.
Regression
- MSE, RMSE
- R-squared
- MAE
- ®MSPE, MAPE
- ®MSLE
Classification
- Accuracy, LogLoss, AUC
- Cohen’s (Quadratic weighted) Kappa
Note: Cover Picture